Using the Multi-view Clustering Algorithm to Cluster Data with Multiple Views
[1]:
from mvlearn.datasets.base import load_UCImultifeature
from mvlearn.cluster import MultiviewCoRegSpectralClustering
from mvlearn.plotting import quick_visualize
import numpy as np
from sklearn.cluster import SpectralClustering
from sklearn.metrics import normalized_mutual_info_score as nmi_score
import scipy
import warnings

warnings.simplefilter('ignore') # Ignore warnings
%matplotlib inline
RANDOM_SEED=10
Load the UCI Digits Multiple Features Data Set as an Example Data Set
[2]:
# Load dataset along with labels for digits 0 through 4
n_class = 5
m_data, labels = load_UCImultifeature(select_labeled = list(range(n_class)))
Running Co-Regularized Multi-view Spectral Clustering on the Data with 6 Views
Here we will compare the performance of the Co-Regularized Multi-view and Single-view versions of spectral clustering. We will evaluate the purity of the resulting clusters from each algorithm with respect to the class labels using the normalized mutual information metric.
As we can see, Co-Regularized Multi-view clustering produces clusters with higher purity compared to those produced by Single-view clustering for all 3 input types.
[3]:
#################Single-view spectral clustering#####################
# Cluster each view separately and compute nmi
s_spectral = SpectralClustering(n_clusters=n_class, random_state=RANDOM_SEED, n_init=100)

for i in range(len(m_data)):
    s_clusters = s_spectral.fit_predict(m_data[i])
    s_nmi = nmi_score(labels, s_clusters, average_method='arithmetic')
    print('Single-view View {0:d} NMI Score: {1:.3f}\n'.format(i + 1, s_nmi))

# Concatenate the multiple views into a single view and produce clusters
s_data = np.hstack(m_data)
s_clusters = s_spectral.fit_predict(s_data)

s_nmi = nmi_score(labels, s_clusters)
print('Single-view Concatenated NMI Score: {0:.3f}\n'.format(s_nmi))

#######Co-Regularized Multi-view spectral clustering##################


# Use the MultiviewSpectralClustering instance to cluster the data
m_spectral1 = MultiviewCoRegSpectralClustering(n_clusters=n_class,
            random_state=RANDOM_SEED, n_init=100)
m_clusters1 = m_spectral1.fit_predict(m_data)

# Compute nmi between true class labels and multi-view cluster labels
m_nmi1 = nmi_score(labels, m_clusters1)
print('Multi-view NMI Score: {0:.3f}\n'.format(m_nmi1))
Single-view View 1 NMI Score: 0.620

Single-view View 2 NMI Score: 0.007

Single-view View 3 NMI Score: 0.004

Single-view View 4 NMI Score: -0.000

Single-view View 5 NMI Score: 0.007

Single-view View 6 NMI Score: 0.010

Single-view Concatenated NMI Score: 0.008

Multi-view NMI Score: 0.866
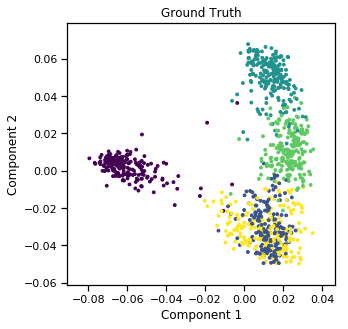
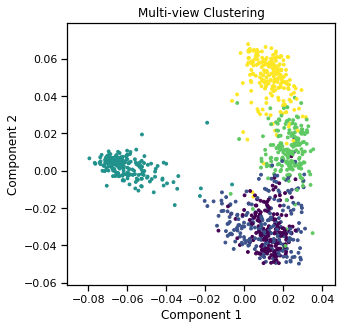
Plots of clusters produced by multi-view spectral clustering and the true clusters
We will display the clustering results of the Co-Regularized Multi-view spectral clustering algorithm below, along with the true class labels.
[4]:
quick_visualize(m_data, labels=labels, title='Ground Truth', scatter_kwargs={'s':8})
quick_visualize(m_data, labels=m_clusters1, title='Multi-view Clustering', scatter_kwargs={'s':8})