Loading and Viewing the UCI Multiple Features Dataset
[1]:
from mvlearn.datasets import load_UCImultifeature
[2]:
# load the quick_visualize function for quick visualization in 2D
from mvlearn.plotting import quick_visualize
%matplotlib inline
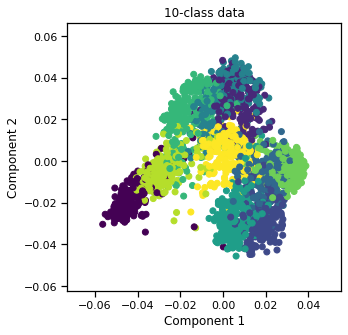
Load the data and labels
We can either load the entire dataset (all 10 digits) or select certain digits. Then, visualize in 2D.
[3]:
# Load entire dataset
full_data, full_labels = load_UCImultifeature()

print("Full Dataset\n")
print("Views = " + str(len(full_data)))
print("First view shape = " + str(full_data[0].shape))
print("Labels shape = " + str(full_labels.shape))

quick_visualize(full_data, labels=full_labels, title="10-class data")
Full Dataset

Views = 6
First view shape = (2000, 76)
Labels shape = (2000,)
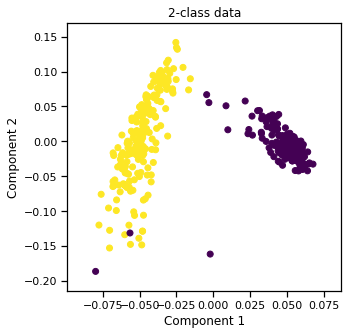
Load only 2 classes of the data
Also, shuffle the data and set the seed for reproducibility. Then, visualize in 2D.
[4]:
# Load only the examples labeled 0 or 1, and shuffle them,
# but set the random_state for reproducibility
partial_data, partial_labels = load_UCImultifeature(select_labeled=[0,1], shuffle=True, random_state=42)

print("\n\nPartial Dataset (only 0's and 1's)\n")
print("Views = " + str(len(partial_data)))
print("First view shape = " + str(partial_data[0].shape))
print("Labels shape = " + str(partial_labels.shape))

quick_visualize(partial_data, labels=partial_labels, title="2-class data")
Partial Dataset (only 0's and 1's)

Views = 6
First view shape = (400, 76)
Labels shape = (400,)